Open for business: Visualizing commuter data to inform a new storefront location in Tokyo
Answering an open question
How can commuter data inform business decisions? And how might this help a business owner open a new location in Tokyo?
I was recently challenged to answer these questions, using data on daily ridership for train stations in the Tokyo metro region in 2008. This data contained information about the mode of transport that riders used to get to and from the station. Specifically, there was the train station code, name, location, and the number of passengers that arrived and left the station using that mode of transportation.
I needed to find a way to present this data in such a way that would be helpful for a business owner in Tokyo opening a new location.
Exploring the data at hand
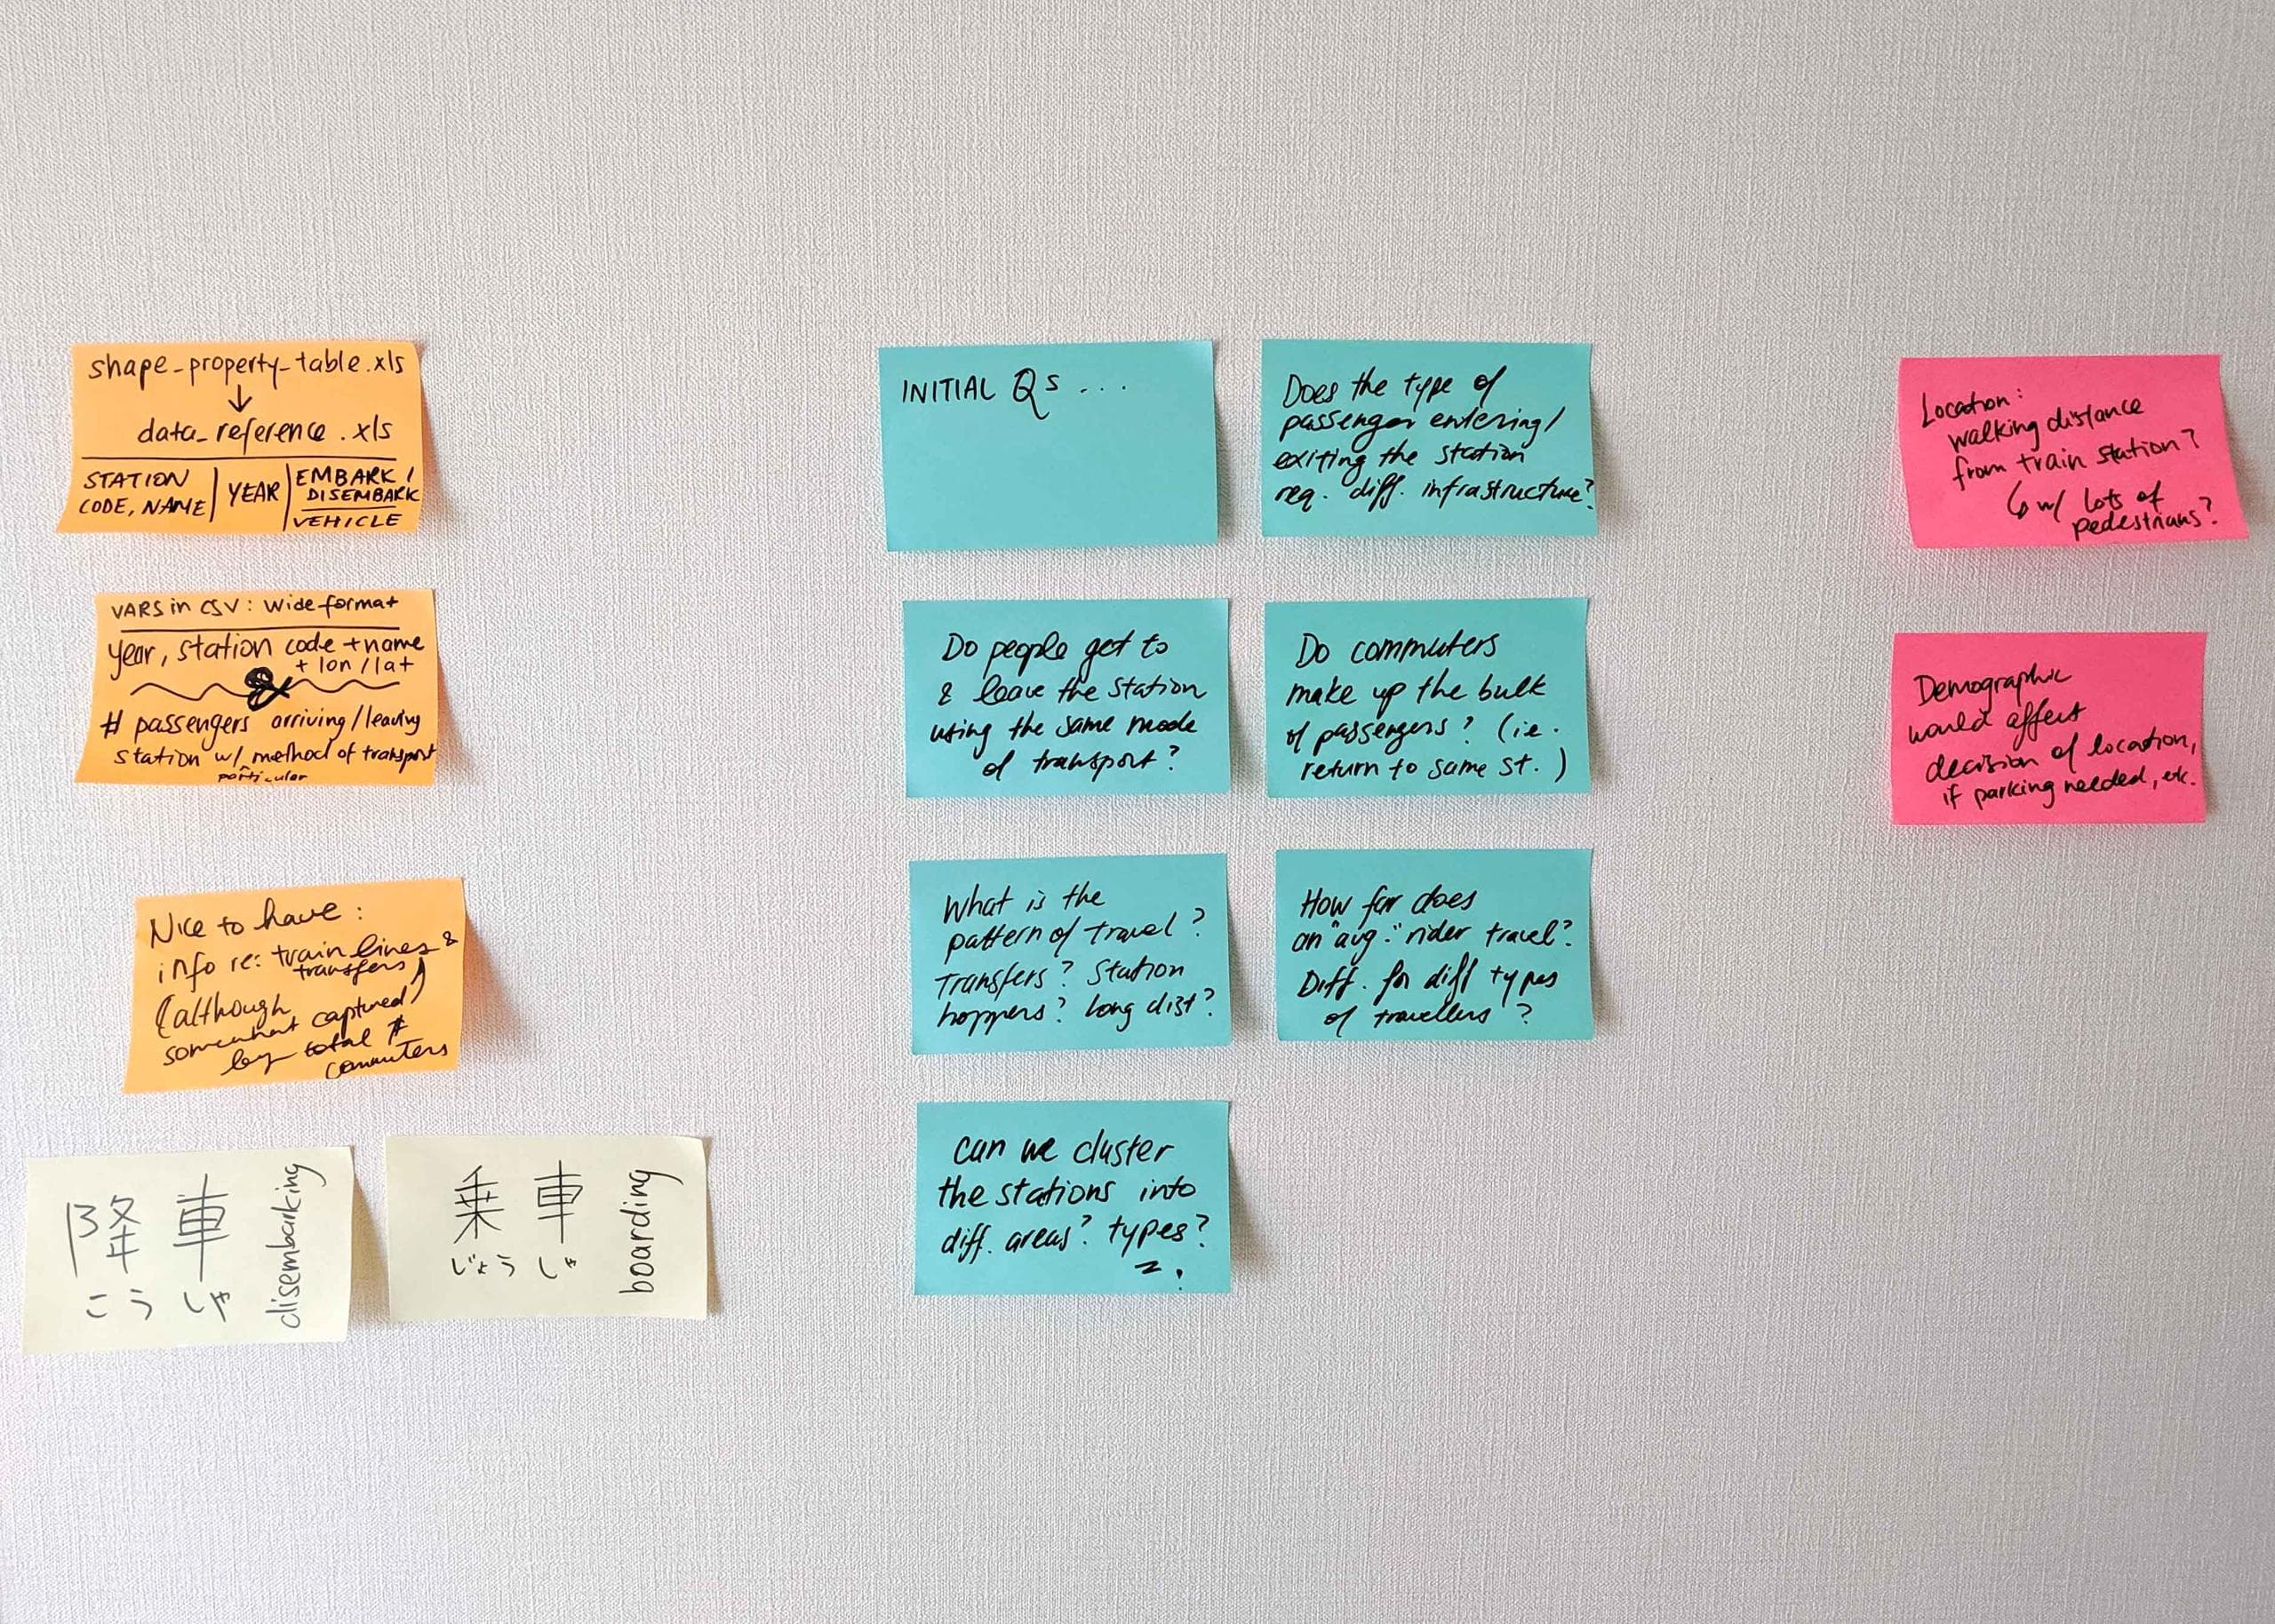
Before diving into the data, I noted down my initial thoughts about the data and any questions I had on some leftover sticky notes and stuck them to the wall.
I decided to use an R notebook to conduct initial explorations of this data. There, I find that 羽田空港第1ビル, i.e. Haneda airport Terminal 1 station, has the highest percentage of riders arriving by aircraft, with 44.38% of total arrivals to the station having travelled by aircraft. I also find that the most popular mode of transportation, by far, is walking-- with a whopping 33,912,753 passengers using that mode of transportation to get to or from large train stations (stations with > 10,000 riders leaving the station).
In the notebook, I also save a cleaned-up version of our data in a CSV format for further use.
The next task of the challenge was to pick a business, any business-- real or imagined, in Tokyo. At this point, I had just come back from a trip to Sendai, where I had become enamoured with what they called ずんだ (zunda), a sweetened edamame paste. (Who knew edamame could be turned into such delicious sweets!)
At risk of sounding like a dramatic foodie, I'd thought that the concept was pretty life-changing for me. So, I picked ずんだ茶寮 (Zunda Saryo) as my business, and rolled with it.

To address the question of how this data could help our business owner open a new location in Tokyo, I did a little more brainstorming on paper and some quick research on our business.
It turns out that the existing Zunda Saryo locations in Tokyo are located by 3 train stations : Shibuya station, Tokyo station, and Haneda airport. In fact, there are multiple storefronts at Haneda airport itself, in both domestic and international terminals. This is consistent with my suspicion that these zunda-based goodies might be catered toward travellers and people strolling by, who stop by casually to buy some last-minute souvenirs or おみやげ (omiyage), and perhaps a sweet treat for themselves to pass the time. (Their products include various packaged zunda sweets and cakes, their infamous zunda shake, and several dine-in cafe offerings.)
What questions could I potentially explore or answer with commuter data?
With the train ridership information, we have an idea of how busy each station is, what kinds of people traffic a certain location, and where the train stations are.
Because we do not yet have a neighbourhood in mind for our new location, this data can potentially help our business owner decide where to open the new storefront.
We might be able to use our data to uncover information about our target demographic. These would likely be pedestrians, and potentially tourists or commuters who are interested in either: trying something novel; enjoying a refreshing drink; purchasing a Sendai/ Miyagi prefecture specialty; or stopping for a snack. Although we have no further demographic information, our data would be answer how many people leave each station's location on foot, for example.
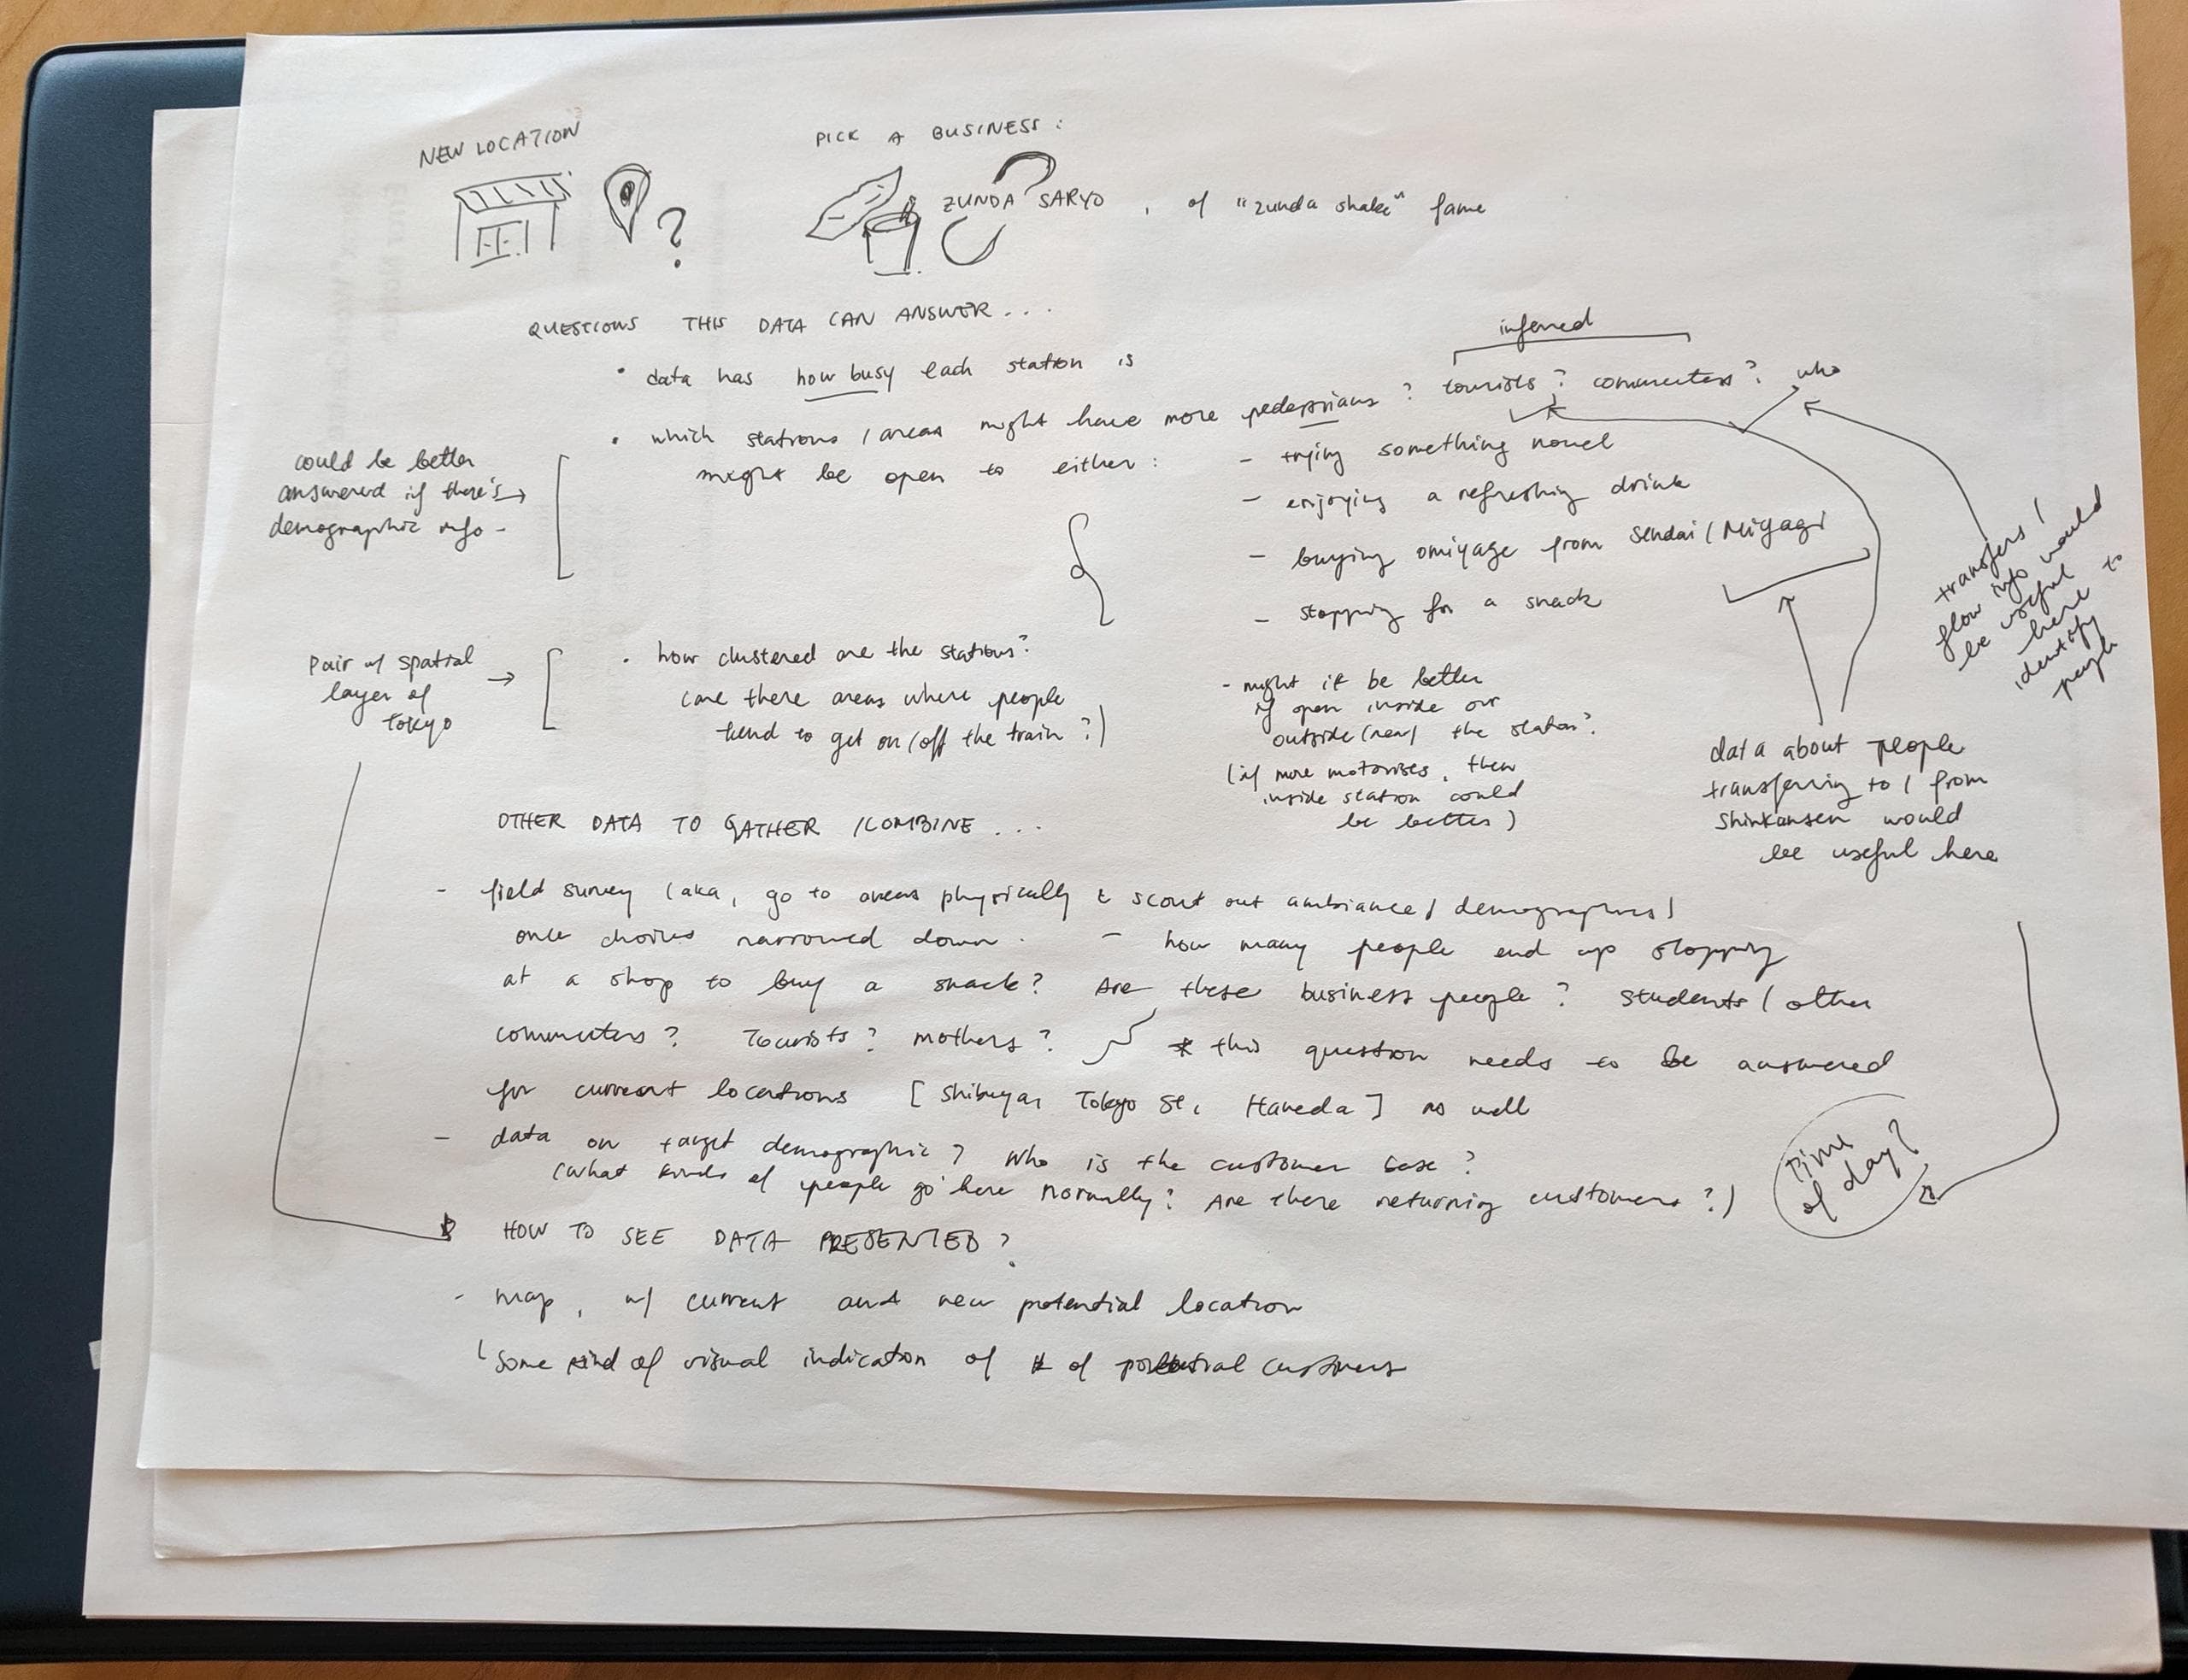
Knowing how the stations are clustered might also aid the location selection process. For example: Are there specific areas where people tend to get on/ off the trains? Where are the high pedestrian traffic areas? With this information, our business owner would be able to situate the new storefront within the proximity of a number of different stations, for example, if they so chose.
Once a neighbourhood or train station has been decided, this data could help explore whether it might be better to open a new storefront to be street-facing, or inside a building. If the vast majority of people arrive by foot, for example, perhaps a street-facing storefront could be an option. If a large number of people frequenting the station arrive by vehicle rather than on foot, then perhaps opening a storefront within the station would make the store available to more people (i.e. after they've parked, been dropped off, etc.).
How might we present this data to make it actionable?
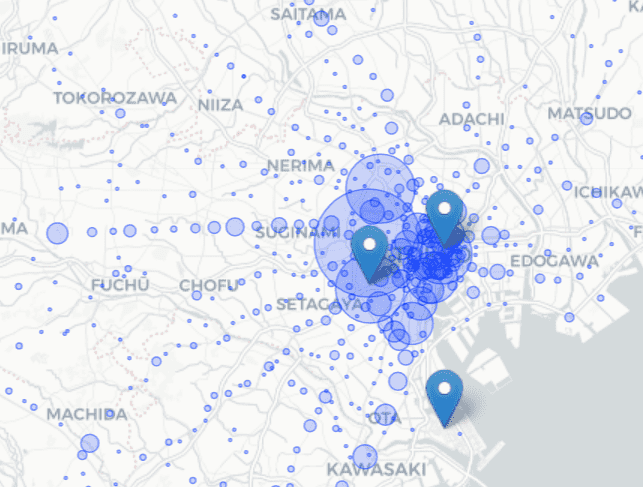
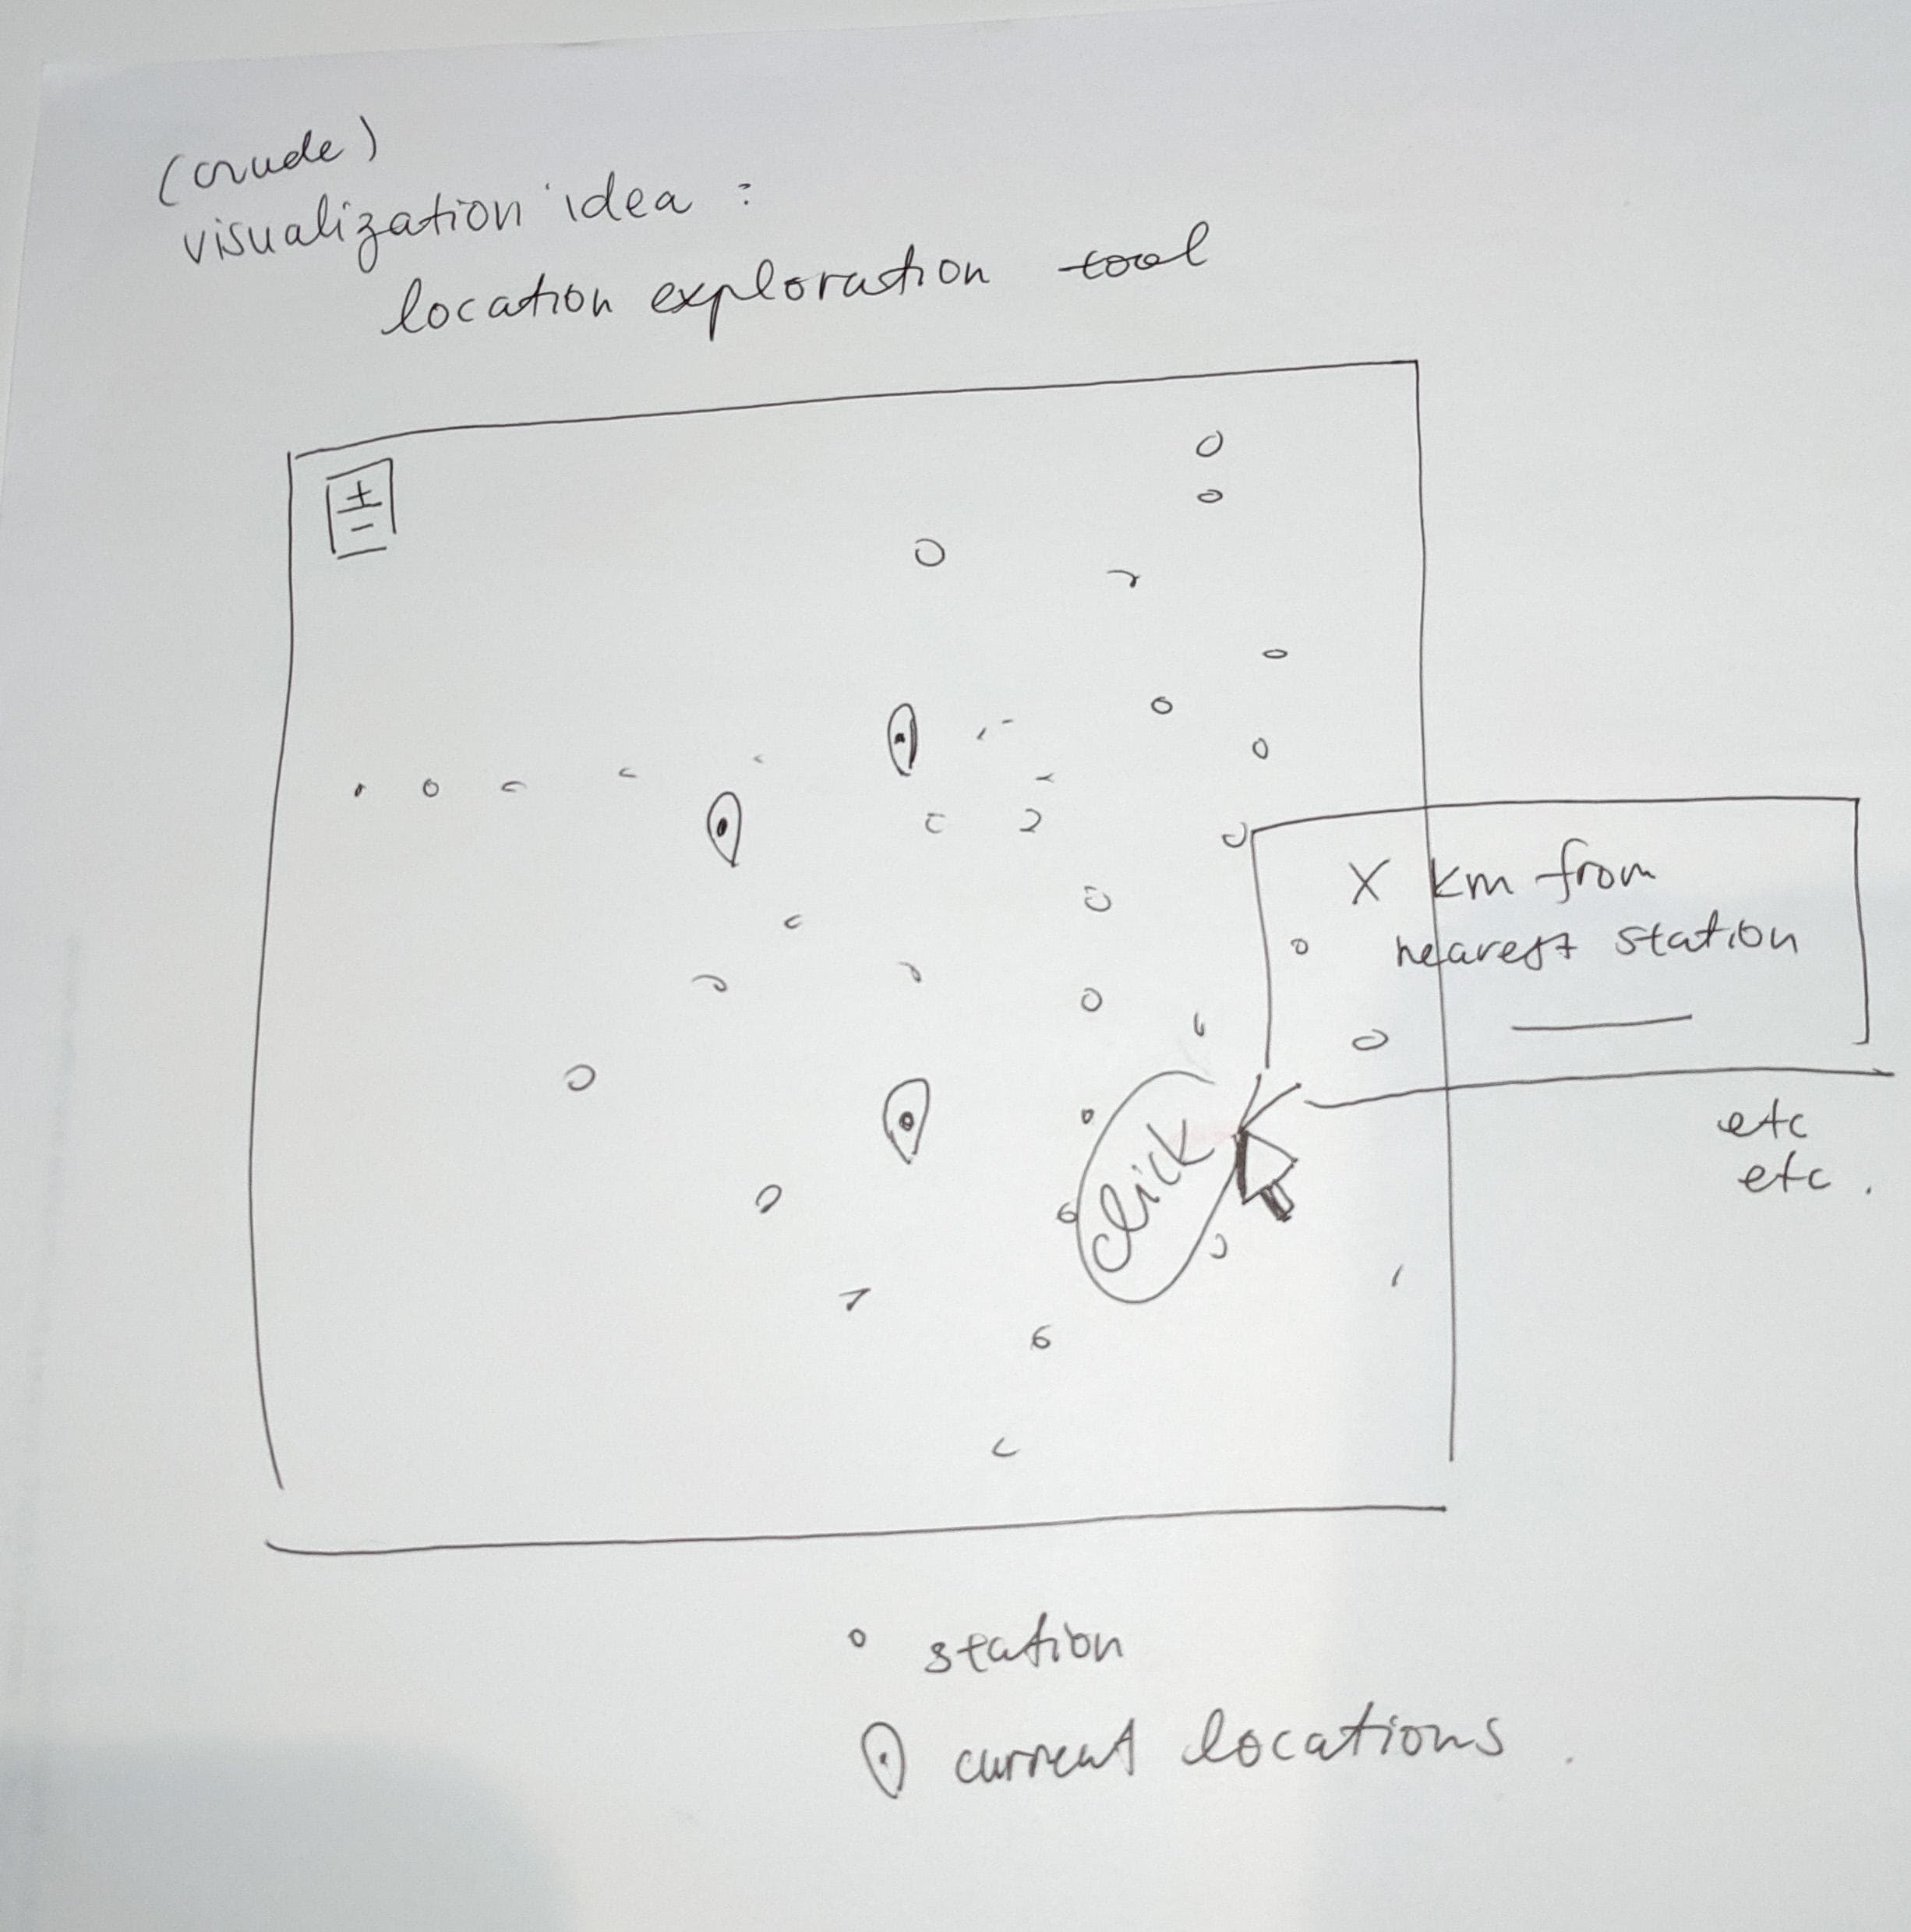
With the data that we have access to in this dataset, a first step would be present this data spatially, layered on a map of Tokyo, with markers at the current locations. Making this map interactive, making it clickable so that the user could click on a point on a map (e.g. representing a potential location) and get some quick stats about:
- The proximity to the closest train station
- How many stations are within X kilometres of the points
- How many people enter/exit the closest train station(s), filtered by mode of transportation
- and maybe other useful things...
Even though a map like this might seem quite basic, I think it might be one of the most useful things the data can provide right off the bat, for the purpose of exploring different potential locations. This also makes the tool versatile enough to use in a number of different contexts and different businesses.
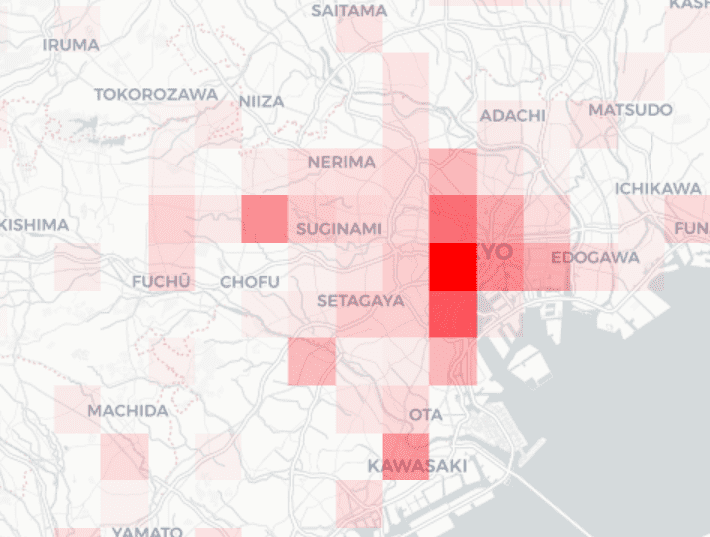
We could also make a heat map representing the amount of riders disembarking stations by walking (or cycling) within a certain radius, which will complement this idea nicely.
I captured this, again, in an R notebook, where I explored some potential avenues and documented the process. In the same notebook, I spent time to make that idea a reality and start the first few steps. In the few hours I spent on this data, I was able to visualize the data spatially and make some progress on testing the calculations needed for the interactive pop-up info. As well, I played around with creating a heat map that represents the number of pedestrians disembarking from train stations within a certain radius.
Gathering other data would allow us to learn even more.
Collecting some more information about the target demographic would make our commuter data more useful. (For example: Who is the customer base? What kinds of people frequent Zunda Saryo? Are there returning customers? What time of day do people stop by?) This demographic data may already be collected by the business; if not, data gathering may need to take place at the existing locations. One form of data collection could be done via field surveys, where we physically visit the areas and scout out the potential location(s): What is the ambience? How many people stop frequently at storefronts to purchase items, as opposed to going directly from point A to point B? Are there mostly business people? Students or other commuters? Tourists? Mothers?
Ideally, it would be great to have access to transit flow data as well. By this, I mean information about how people move between trains, or transfer between different types of trains, including the bullet train. Combined with information about purchasing habits of commuters and travellers (i.e. do they make purchases in the middle, or at the end of their journeys?), this might also be informative in opening a new location.
Finally, if we had data on some measure of success (e.g. profit, traffic) of a large sample of dessert and/or beverage shops in the Tokyo area, we might be able to compare success with the proximity of these shops to train stations with different characteristics. Is proximity to a station with certain characteristics (e.g. stations that have greater than X% or X number of pedestrians) predictive of success?
To be continued...
Overall, this was a fun little project! There are still some things that would need to be done to execute the idea (perhaps an web app or dashboard), but I was able come up with some neat ideas and enjoy the process along the way.